Data Dashboards
Below are four interactive dashboards, designed in partnership with Open Architects. The dashboards provide accurate, timely data about educational trends and outcomes in Berkshire County in the areas of academics, enrollment, finance, and MCAS.
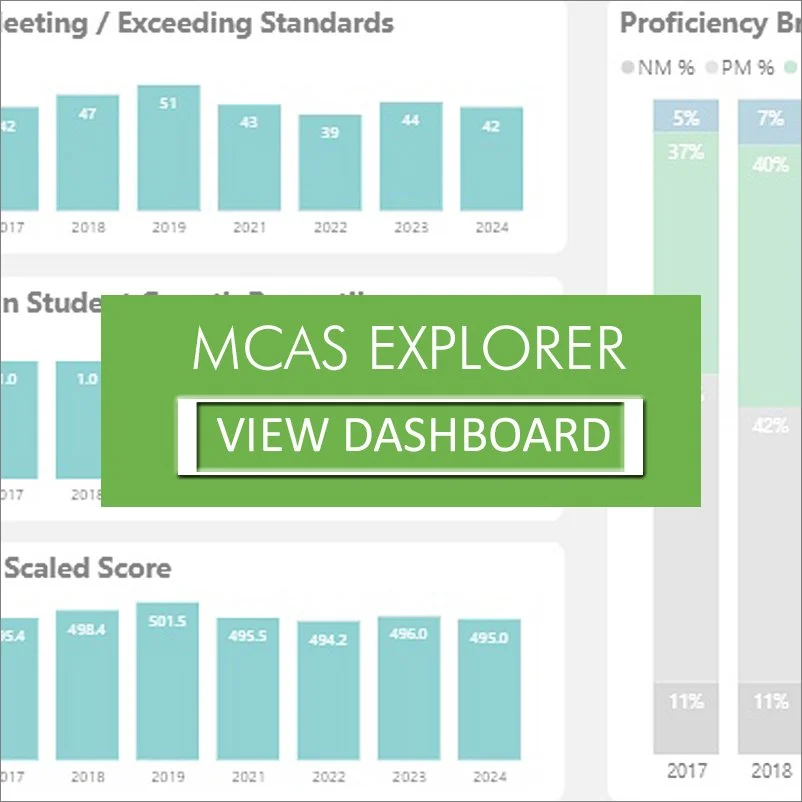
The data can be broken down by school, district, and other subcategories, providing a resource for districts and community partners to retrieve data needed for reporting, grant applications, and analysis. The dashboards are also useful for community members who want to know more about the schools in the region. As shown below, the MCAS dashboard provides information such as growth percentile, scores, and proficiency levels.
Description of dashboards.
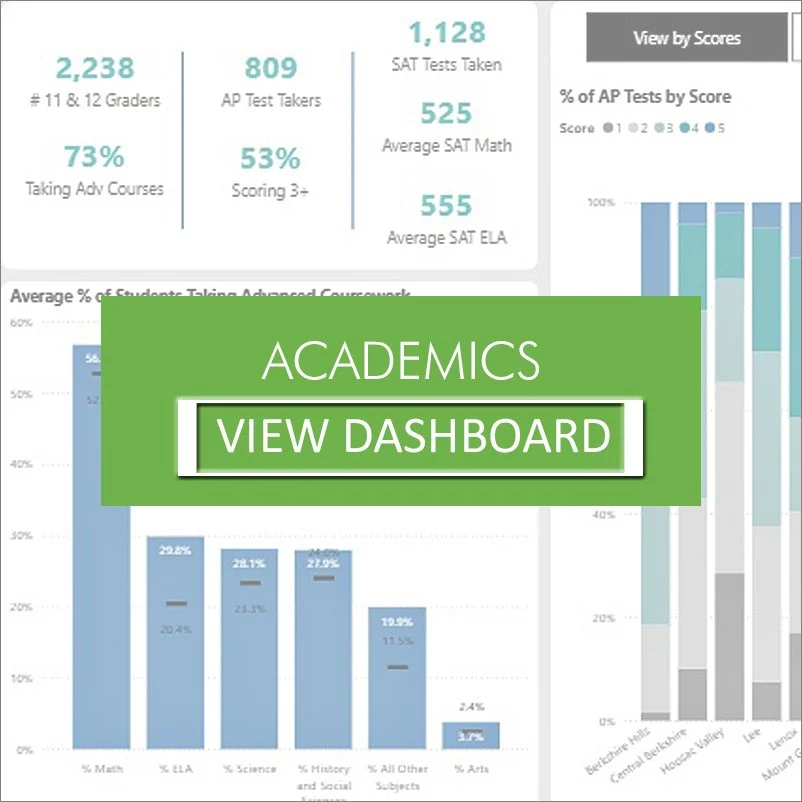
The Academic Dashboard provides data on high school academics and outcomes along with post-high school data. It features SAT and Advanced Placement test scores, graduation rates, and college attendance patterns.
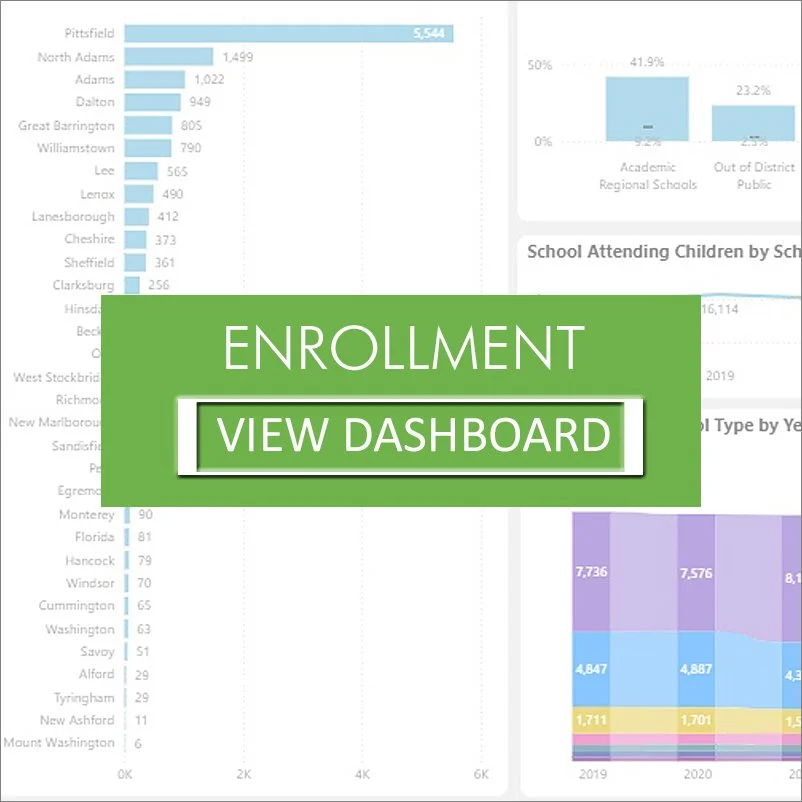
The Enrollment Dashboard features student enrollment data broken down by town, district, grade level, and various demographics. There is also information about student choice patterns in and out of districts.
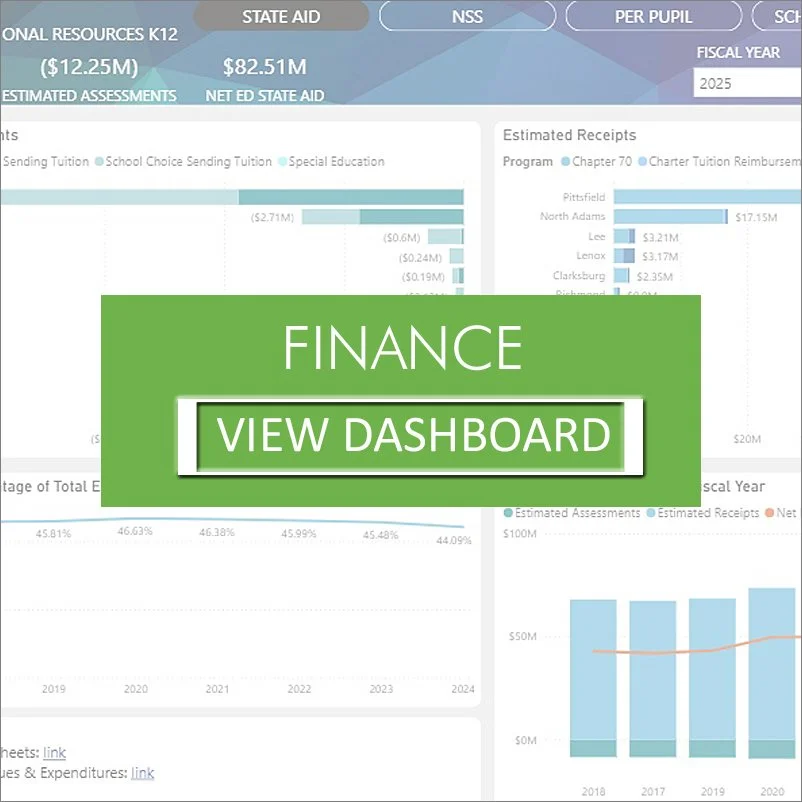
The Finance Dashboard includes a wide range of data about state aid, school choice, staffing, net school spending (NSS),and per pupil costs.
The MCAS Explorer Dashboard provides breakdowns of MCAS scores and proficiency rates for English Language Arts, Mathematics, and Science. The data is useful for examining MCAS scores over time and comparing results among districts.
DASHBOARD DIRECTIONS
Click VIEW DASHBOARD. The Dashboard will open up within the website view. In order to maximize the view for ease of use and manipulation, click on the expand window icon (two arrows) at the bottom left corner of each Dashboard.